
I opened Pew’s methodology page before I read a single result. Then I did the same for Ahrefs, Chartbeat, SparkToro, Seer and SEOcrawl. Who measured, on whom, over what dates, with what sample — that comes first. The number comes second.
Short answer: yes. Every study I found shows fewer clicks where an AI Overview appears, or falling search referrals since it launched. The size depends on what was measured: 39.8% fewer outbound organic clicks in one randomized test, 58% lower click-through on top-ranked pages in an Ahrefs model, a median 10% decline across 19 publishers in Digital Content Next’s data. Google has published none of its own.
The claim on file is short. On August 6, 2025, Liz Reid, Google’s head of Search, wrote that total organic click volume from Search to websites was “relatively stable” year over year, and that Google was sending slightly more high-quality clicks (Google). The post had no dataset, no chart and no Search Console export. On the July 22, 2026 earnings call, Google said its AI features send billions of clicks to websites every week (transcript). Search Engine Journal’s review of that quarter called the click claims uncheckable (SEJ), and Search Console does not separate AI Overview clicks from ordinary organic ones (SEJ).
One party holds the click data. It published two sentences. Every figure I use comes from someone measuring from the outside.
What a user does when the summary appears #
Pew tracked the browsing of 900 U.S. adults through March 2025: 68,879 unique Google searches (Pew). 18% of them produced an AI summary.
On pages with a summary, users clicked a regular result in 8% of visits. On pages without one, 15%. A click on a link inside the summary happened in 1% of visits. The session ended on the spot in 26% of visits to summary pages, against 16% without.
Now the number I care about most. In 88% of cases the summary cited three or more sources. Those sources are publisher pages. Across all visits to a summary page, a click on any of them: 1%.
I call that extraction. Pages get cited and not visited. The word is mine. The 88% and the 1% are Pew’s.
The sample is 900 people over one month, and the analysis is observational. The data is from March 2025.
What it costs the top result #
Ahrefs took 300,000 keywords — 150,000 that triggered an AI Overview in December 2025 and 150,000 informational keywords that did not — and compared them against December 2023, before the feature existed (Ahrefs). Position-one click-through on the Overview keywords went from 7.3% to 1.6%. The informational keywords without an Overview also fell, from 7.6% to 3.9%. Ahrefs used that drop as the baseline, forecast 3.7% for the Overview keywords, and reported the gap: 58% below forecast.
The loss thins out down the page. Position 2 lost 50.8%. Position 5 lost 32.6%. Position 10 lost 19.4%.
Two flags. It is a model, not a count. And Ahrefs sells SEO software. Its April 2025 run of the same method produced 34.5%. The direction held. The size moved.
The only randomized test #
Agarwal and Sen assigned 1,065 desktop Chrome users to normal Google or Google with AI Overviews hidden (TSE abstract; summary). When an Overview appeared, outbound organic clicks fell 39.8% and zero-click searches rose 34.5%. With the Overview hidden, organic clicks per search went from 0.37 to 0.62. Sponsored clicks and clicks inside Google’s own results did not move significantly.
The same experiment tested Google’s quality argument. In both groups about four in ten same-tab clicks went back to the results page, roughly 18% of visits ended inside ten seconds, and time on site was statistically the same (SEJ). The clicks that vanished were not the low-value ones.
Informational queries carry the effect. An Overview appeared, or was set to appear, on 53% of informational queries, 15% of navigational and 6% of transactional.
The paper is a working paper on SSRN, posted April 3, 2026 and revised June 17, 2026. No peer review yet. Desktop Chrome only.
Where the clicks go #
SparkToro, working from Similarweb panel data for U.S. searches from January through April 2026: 68.01% of Google searches ended without a click (SparkToro). In 2024 the figure was 60.45%. A decade ago it was about 45%.
search
  |
  v
results page with AI summary
  |
  +--> no click at all ............ 68.01% of searches
  |
  +--> a click happens
         +--> open web .............. 66% of clicks
         +--> Google's own surfaces . 27% of clicks (YouTube, Maps, AI Mode)
         +--> paid ads ............... 6% of clicks
Source for every line: SparkToro, January to April 2026. More than a quarter of the clicks that do happen never leave Google.
SparkToro does not isolate AI Overviews as the cause, and AI Mode accounted for only 0.34% of searches in the window (Search Engine Land). The total also counts searches nobody expects to click, such as a weather check. SparkToro sells audience research software. The rise was already under way before AI Overviews. What I cannot state is how many of the 7.56 points gained since 2024 belong to them.
What publishers recorded #
Chartbeat data, published by the Reuters Institute: Google search traffic to publishers fell by a third worldwide in the year to November 2025 (Press Gazette). In the U.S., across more than 2,500 sites, it fell 38% (Digiday).
Chartbeat’s 2026 Publisher Playbook: Google Search referrals down 40.2% from July 2025 to July 2026, after a 21.9% fall the year before. Discover went from a 6.6% decline to 34.3% (SEJ). Search’s share of network pageviews dropped from 9% to 5% between July 2024 and July 2026 (Android Headlines).
By size, from an earlier Chartbeat report (Axios, March 17, 2026): over two years, search referrals fell 60% for small publishers, 47% for medium and 22% for large (Axios). Different window from the Playbook. I do not add the two.
SEOcrawl followed a fixed cohort of 16,661 sites with Search Console data in every month since May 2024 (SEOcrawl). Google organic clicks went from 3.72 billion (September 2024 to August 2025) to 3.16 billion (September 2025 to August 2026): 559 million fewer, down 15.0%. The median site lost 20.1%. 69% of sites lost clicks. The top 1% of sites produce about 70% of all clicks, so the aggregate flatters the typical site. The year-over-year decline widened from 7.5% in May 2025 to 21.8% in August 2026.
That is SEOcrawl’s own user base, not a random sample, and AI Overview clicks are logged as organic in Search Console, so the study cannot isolate them (SEOcrawl release).
No replacement traffic exists at scale. Chartbeat puts AI referrals at 0.01% of traffic — eightfold growth over two years, and a decline across ChatGPT, Claude, Perplexity, Copilot and Gemini during 2026.
Revenue and reach #
Google’s Q2 2026 Search and other revenue was $63.27 billion, up 17% year over year (PPC Land). At I/O in May 2026, Sundar Pichai put AI Overviews at more than 2.5 billion monthly users and AI Mode at more than 1 billion (Google).
Search revenue rose while publisher referrals fell. Both are on record. No published data ties one to the other, and I am not going to supply the tie.
The arithmetic Google has not addressed #
Google said click volume was stable. Google says AI features drive query growth. If both statements held across the same period, clicks per query fell. That is an inference from two Google statements, not a measurement. One chart from Google would confirm it or kill it.
The evidence that cuts the other way #
I looked for it, so it goes on the record.
Seer Interactive measured organic click-through on AI Overview queries falling from 1.76% to 0.61% between June 2024 and September 2025, across 3,119 informational queries from 42 organizations (Search Engine Land). Its 2026 update found a rebound from a 1.3% floor in December 2025 to 2.4% in February 2026 (Seer). Seer calls that leveling off, not recovery, and queries with no Overview still earned 3.82% (DesignRush). Seer also recorded a 41% fall on queries with no Overview in 2025 (Seer), so part of the click loss is not attributable to the feature.
Digital Content Next measured a median 10% decline across 19 member publishers from May to June 2025 (SEJ). Bauer reported a single-digit decline (Press Gazette). Chartbeat’s network pageviews averaged 31.1 billion a month from January to July 2026 against about 32 billion in 2025 — roughly flat — because direct and dark-social traffic grew while search shrank.
On October 15, 2026, Google announced five changes to how AI Mode and AI Overviews show links: inline links placed higher more often, a test of a section for official sites, wider news carousels, thumbnails on related links, and creator profile links in video results (Google). These change placement. I found no mention, in Google’s post or the trade coverage, of a report that separates the clicks those links produce.
The courts have not helped publishers. A federal judge dismissed Penske Media’s and Chegg’s antitrust suits in October 2026, treating expected traffic as an expectation, not an agreement (Android Authority). After the UK’s CMA ordered an opt-out, Google began rolling out a Search Console control that excludes a site from AI features while keeping it in Search (Press Gazette). The European Commission opened its own investigation in December 2025 (IBA).
The size split, plotted #
I plotted the Chartbeat size split from the Axios report. The script draws what was published and nothing else.
import sys

try:
    import matplotlib
    matplotlib.use("Agg")
    import matplotlib.pyplot as plt
except ImportError as exc:
    sys.exit("matplotlib is required: " + str(exc))

# Chartbeat data as reported by Axios, March 17, 2026.
# Decline in traditional search referral traffic over two years.
DATA = [
    ("Small (<10k daily pageviews)", 60),
    ("Medium (10k-100k)", 47),
    ("Large (>100k)", 22),
]
COLORS = ["#00E5FF", "#FF2BD6", "#FF9F1C"]
BG = "#0E1117"
FG = "#E6EDF3"
OUT = "figure1_search_referral_decline.png"


def main():
    labels = [row[0] for row in DATA]
    values = [row[1] for row in DATA]
    try:
        fig, ax = plt.subplots(figsize=(8, 4.8), facecolor=BG)
        ax.set_facecolor(BG)
        bars = ax.bar(labels, values, color=COLORS, width=0.55)
        for bar, value in zip(bars, values):
            ax.text(
                bar.get_x() + bar.get_width() / 2,
                value + 1.5,
                "-" + str(value) + "%",
                ha="center",
                color=FG,
                fontsize=13,
                fontweight="bold",
            )
        ax.set_ylim(0, 75)
        ax.set_ylabel("Decline in search referrals (%)", color=FG)
        ax.tick_params(colors=FG, labelsize=9)
        for side in ("top", "right"):
            ax.spines[side].set_visible(False)
        for side in ("left", "bottom"):
            ax.spines[side].set_color("#30363D")
        ax.set_title(
            "Search referral decline over two years, by publisher size",
            color=FG,
            fontsize=12,
        )
        fig.tight_layout()
        fig.savefig(OUT, dpi=160, facecolor=BG)
    except OSError as exc:
        sys.exit("could not write figure: " + str(exc))
    for label, value in DATA:
        print(label.ljust(30) + "-" + str(value) + "%")
    print("wrote " + OUT)


if __name__ == "__main__":
    main()
Output:
Small (<10k daily pageviews)  -60%
Medium (10k-100k)             -47%
Large (>100k)                 -22%
wrote figure1_search_referral_decline.png
In plain terms: a small publisher has 40 search visits left for every 100 it had two years earlier. A medium publisher has 53. A large one has 78. The smaller the site, the less margin it had.
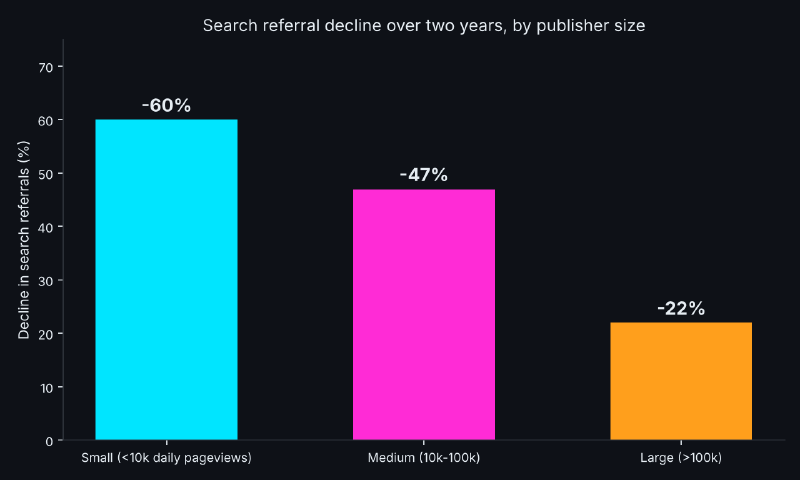
Figure 1. Decline in traditional search referral traffic over two years, by publisher size (small: under 10,000 daily pageviews; medium: 10,000 to 100,000; large: over 100,000). Source: Chartbeat data reported by Axios, March 17, 2026. Bars drawn from the published percentages; no values estimated.
Google holds the one dataset that can contradict every number above. It has published a sentence in its place. One Search Console filter would settle it. As of today, I cannot find one.